The City of Roswell, GA has a long history with GIS and Geographic Technologies Group (GTG). In 2015, they contracted GTG for a GIS Strategic Plan, which led to the implementation of SafeCityGIS software and services. This contributed to them earning the title of “#18 Safest City in the United States” by City Crime Rankings. Since then, GTG has assisted with numerous other GIS implementations, including GreenCityGIS for Recreation and Parks operations as well as public-facing tools including multiple Story Maps and My Neighborhood Services.
When the COVID-19 pandemic hit the United States in March of 2020, the City of Roswell was quick to reach out to GTG for support in managing their response efforts. They were looking to track and enhance COVID-19 efforts and response, along with the status of the pandemic in their city, through the use of modern GIS tools and environments. This included integration with 911 systems, computer-aided dispatch (CAD) data, and Esri’s Web AppBuilder, Dashboards, and Story Maps. The City knew that GTG’s knowledge of their existing system would expedite the application creation process, and the GTG team offered the knowledge and expertise they required in regard to their existing data, integration opportunities, and Esri solutions.
The collaboration process included the development of methods for data visualization, which is a staple of GIS. GTG and the City of Roswell implemented, configured, and introduced various Esri solutions, including Dashboards, Story Maps, and the Community Analyst solution. A primary goal was expanding existing data integrations with 911 systems, OSSI and CAD. Data extraction was scheduled nightly to provide updated information on a daily basis. Extraction data was also expanded to date back to January 1, 2019, so that all incoming calls from the pandemic period could be analyzed against the previous year’s calls during the same months, weeks, and days for a deeper perspective on pandemic effects and response.
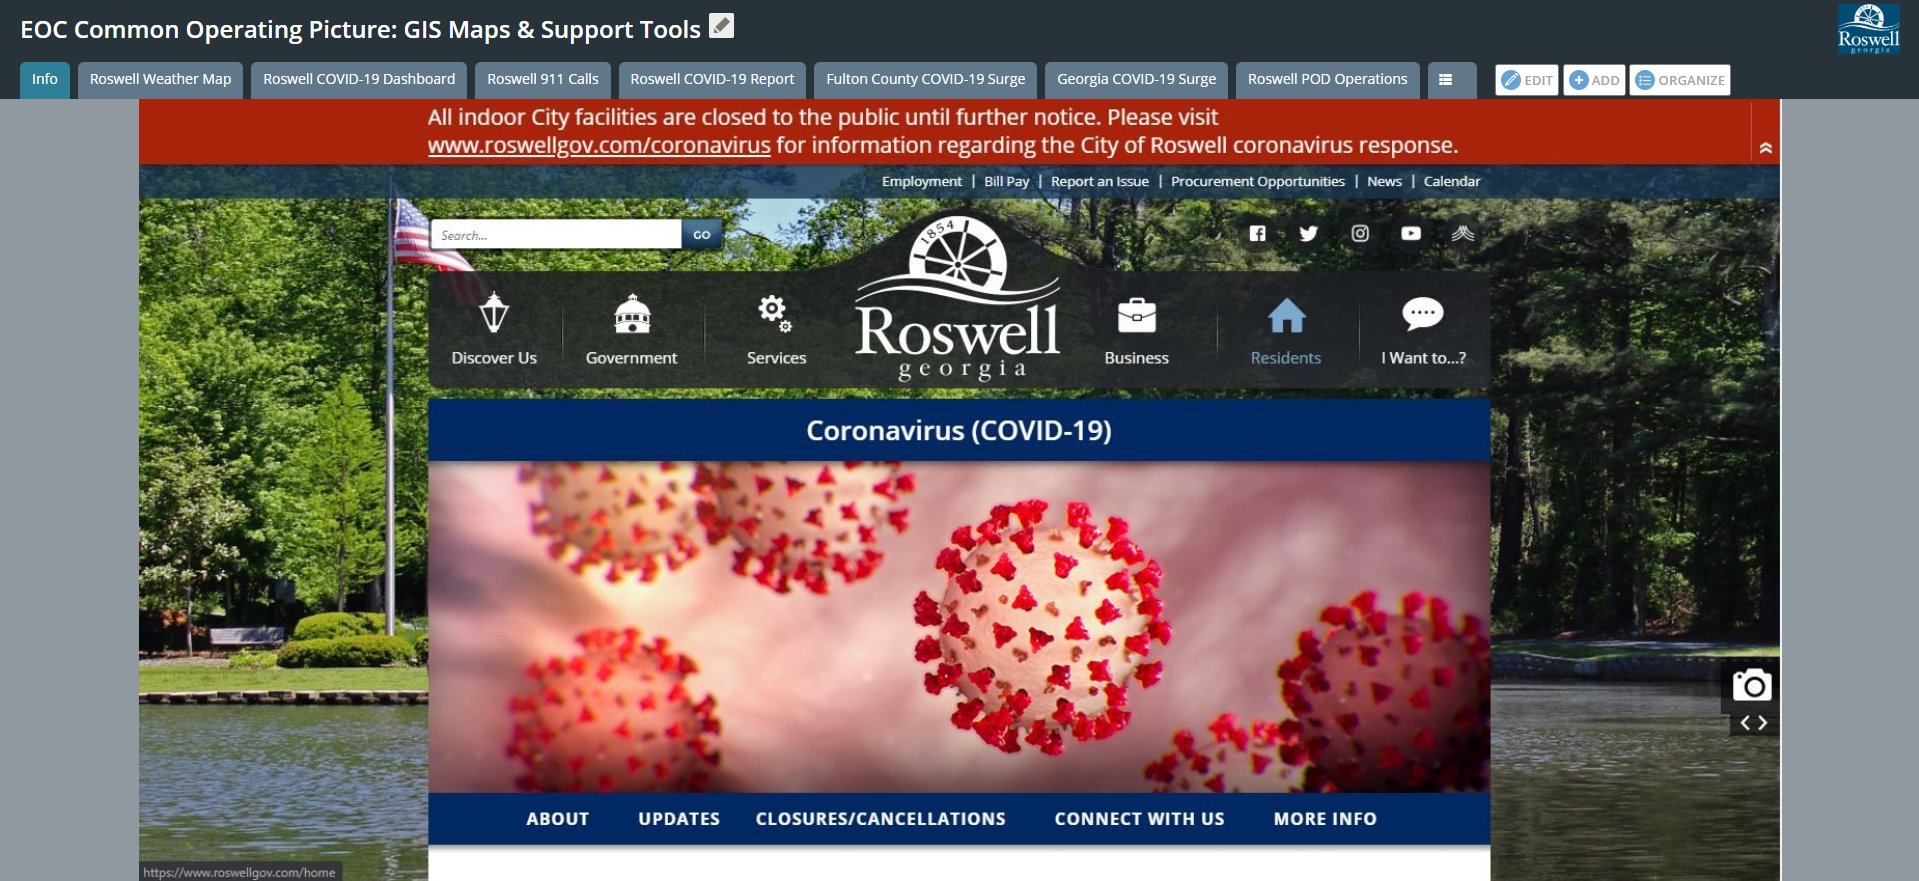
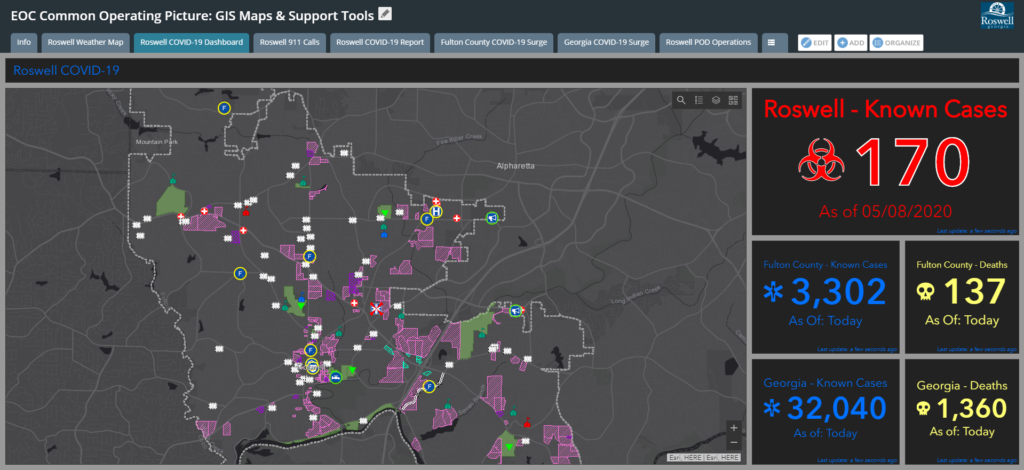
The creation of a COVID-19 Dashboard was vital to the success of the City’s response to the pandemic. The internal dashboard provided information and tracking on known affected areas and the number of cases within the City of Roswell, Fulton County, and the State of Georgia. Available data layers included critical facilities (with links to contact personnel), clinics, schools, high-density residential areas, medical providers with COVID-19 response capability, and more. The application also includes attached documents showing the support capabilities of select city buildings and links to additional city resources including COVID-19 projections, news, and a dedicated blog.
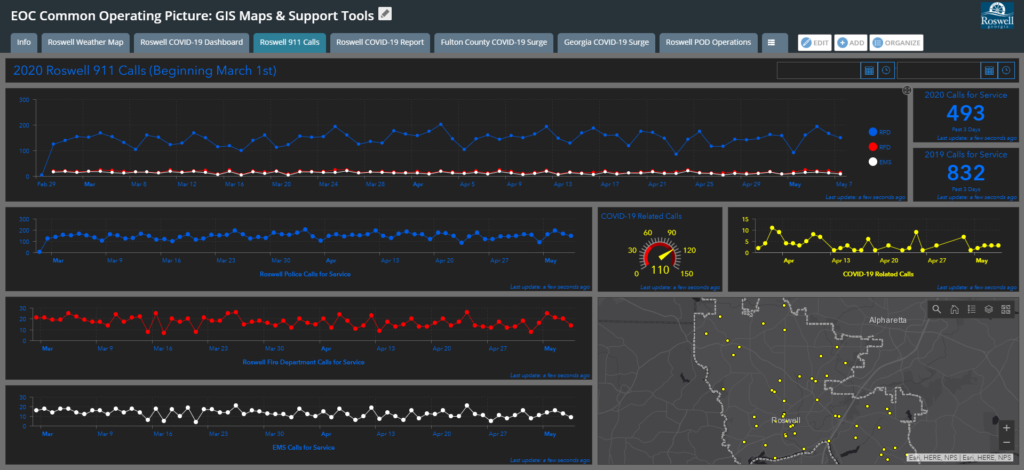
The second Dashboard was for internal use and tracked call counts and trends for the City of Roswell 911 calls. Call data was collected beginning March 1, 2020 and included details on police, fire, and EMS services and response. Data was pulled in to track COVID-19 related call counts, trends, as well as 2020 and 2019 calls for service.
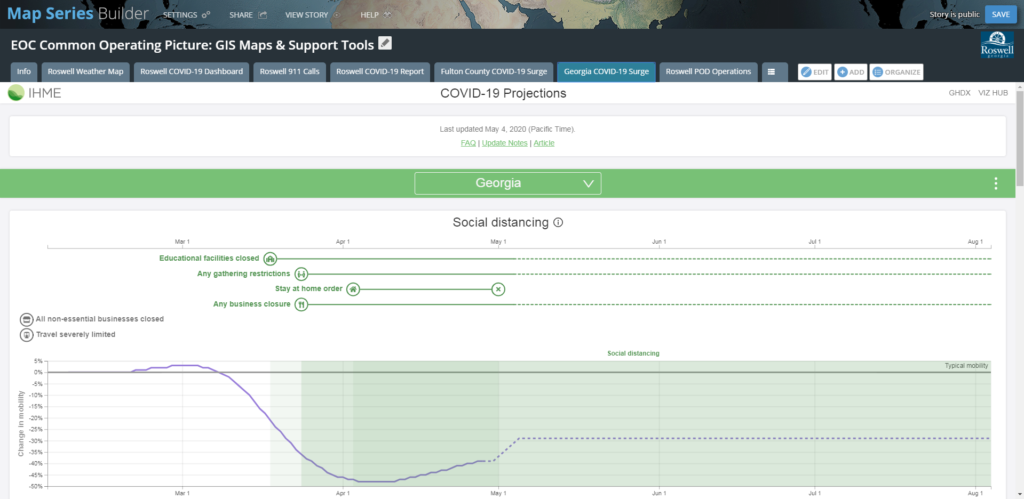
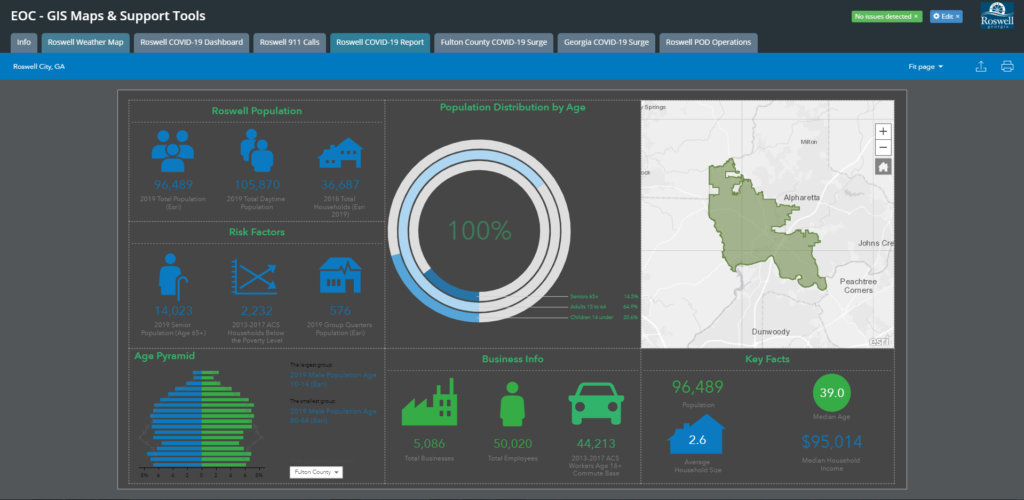
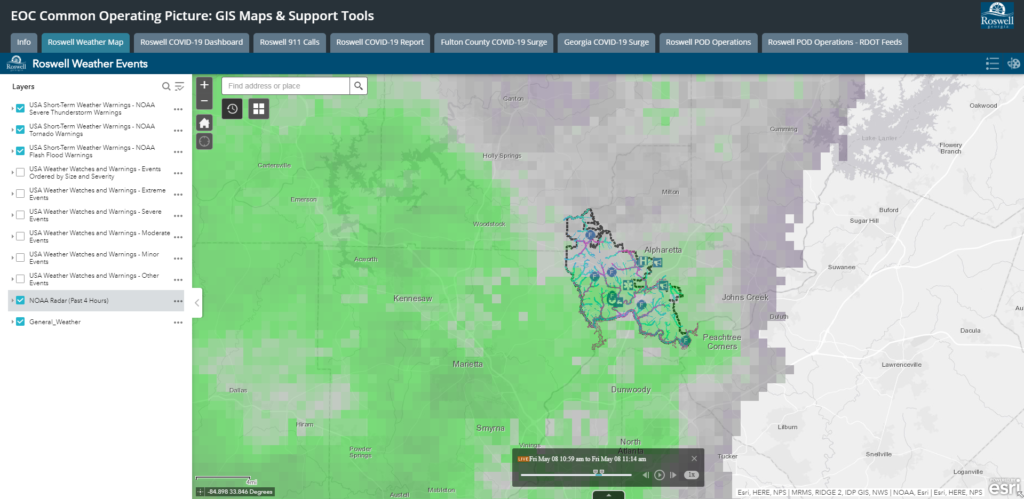
Further applications included the Community Analyst solution and the Roswell Weather Events Web AppBuilder. Esri’s Community Analyst created a critical demographic report for COVID-19 susceptible areas and populations. It was supplemental to the primary Dashboards. The Roswell Weather Events Web AppBuilder was implemented for the Emergency Operations Center (EOC) and featured real-time weather, watches, and warnings. This latter application is to be used as a general EOC tool during and after the pandemic.
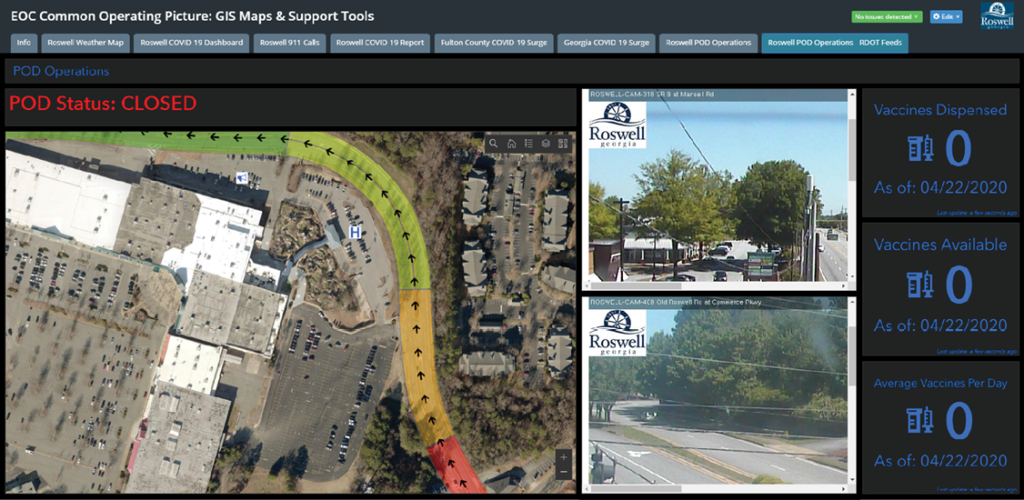
Taking their response one step further, the City of Roswell is preparing for the future arrival of a vaccine with a Point of Distribution (POD) Operations dashboard. This application tracks the number of available vaccines, how many vaccines are dispensed, and the average number of vaccines administered per day. It also features live traffic cams to monitor points of potential congestion sites around the location where the vaccine is planned to be administered to the public.
Since the implementation of advanced GIS applications and tools, the City of Roswell has gained an increased awareness in COVID-19 response efforts. They have the ability to evaluate patterns and trends associated with historical and current call volumes and are able to reference a comprehensive environment for visualization, response, and analysis. The internal 911 Calls Dashboard gives the EOC the ability to view COVID-19 related calls spatially, as well as to understand the number of incoming calls and how they vary over time. All GIS solutions were embedded in the City’s WebEOC environment, and the Map Series tool gives the Roswell team the ability to expand and edit this environment without direct assistance from WebEOC administrators. The EOC Common Operating Picture is a program that will continue to grow, expand, and evolve during the pandemic response and into the future.
——
For more information about SafeCityGIS software and services, please contact the GTG team at moreinfo@geotg.com or calling 888-757-4222. You can also learn more at SafeCityGIS.com.