City of South Portland, ME — Parks and Recreation Solutions
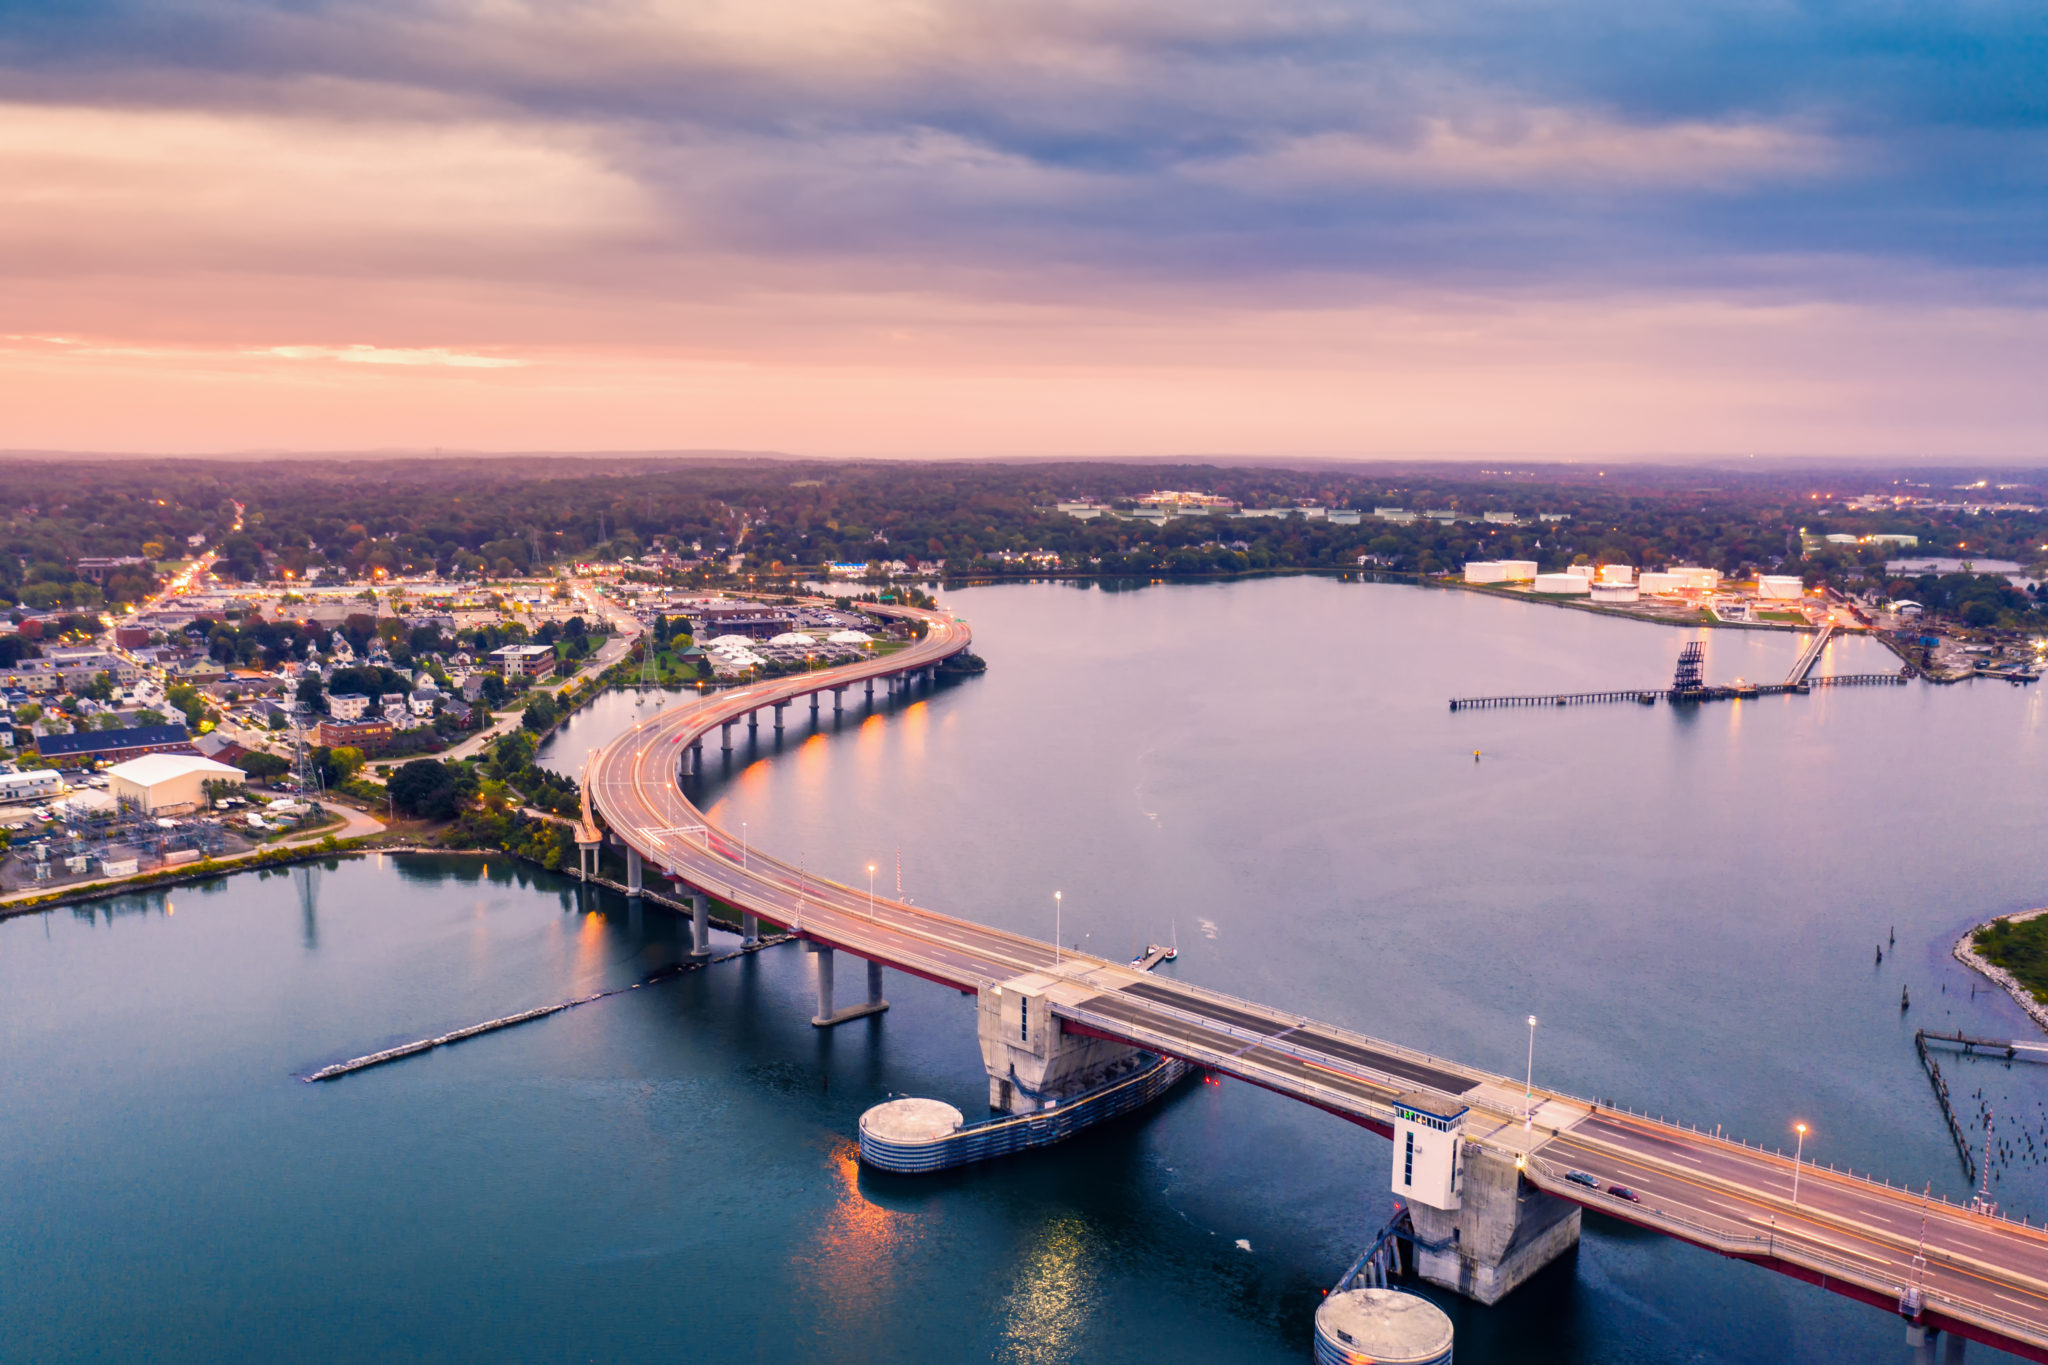
In 1895, the City of South Portland, Maine broke off from Cape Elizabeth to form its own municipality. With a population of 25,000 and covering just 14 square miles, the city is the fourth largest in the state. It sits on the beautiful Portland Harbor and has become the retail capital of Maine. In fact, the first strip mall was built in the 1950’s and remains as the Mill Creek shopping center at the base of the Casco Bay Bridge, which stretches across the harbor to Portland.
Of their 14 square miles, The City of South Portland maintains over 350 acres of parks, recreational facilities, trails, and coastline. They boast a unique mix of outdoor spaces including wooded areas, beaches, and fishing ponds. With so much beautiful space to share, their Parks and Recreation Department is dedicated to maintaining the beauty and access for all citizens and visitors.
As part of their initiative to elevate their Parks and Recreation operations, the city decided to employ GIS services and reached out to Geographic Technologies Group (GTG) in August of 2019. The City of South Portland Parks and Recreation Department didn’t have a work order system in place at the time and was also struggling with the management of park assets. The GTG team brought solutions to the table that would address these issues and bring in map layers for deeper analysis and insight. The team decided to leverage WorkForce by ArcGIS to accomplish creating, maintaining and closing work orders for Park and Recreation staff along with the GreenCityGIS software and services suite for asset inventory and operational efficiencies.
Implementing Custom GIS
GreenCityGIS is a bespoke solution created by GTG for more comprehensive viewing and assessment of parks, assets, and recreation facilities. The project began with an overview of their current processes and applications so that GTG could utilize all existing resources and data layers with the new software implementations. Then five custom applications were designed and built for the city.
- Parks Viewer – Allows the city staff to view detailed information about park assets along with their locations on a map.
- Park Finder – Provides citizen enablement by showcasing area parks on a map, allowing users to search by available amenities and location.
- Story Map – Presents parks information, history, facts, and imagery on a map for the public to explore online.
- Dashboard – Lets city staff monitor asset data with various (and customizable) charts, graphs, and gauges.
- Collector App – Gives city staff a mobile solution for collecting, documenting, and editing GIS data in the field for assets and facilities.
With the collector app, the Parks and Recreation team members were able to go on-site to facilities around the city to perform an in-depth inventory of all assets, their locations, and their conditions. Once this data was collected, GTG integrated Workforce for ArcGIS with their data layers to allow their team to assign work orders for park assets. This system allows them to better track maintenance work and to prioritize which assets are in the greatest need of replacement or repair. Additionally, the web-based app allows for greater visibility of their park assets, which — along with the other GreenCityGIS applications —assists with analyzing and querying information for data-driven decision making by city officials.
City-wide Benefits
The city has experienced many benefits from the implementation of GIS for their Parks and Recreation Department. They’ve obtained a greater knowledge of their park assets and this information is now at their fingertips with the Parks Viewer and Operations Dashboard. Field team members can efficiently collect and document data in the field with the Collector App, and management is able to quickly create work orders and assign responsibility to their team with the Workforce program. Citizens are engaged with the tools to locate and access information about their city parks with the Parks Finder and Story Map applications, which are both hosted online and public-facing.
Perhaps one of the greatest benefits of implementing GIS for Parks and Recreation is the increased efficiency the Department is experiencing. Workforce streamlines the assignment of workers to work order along with monitoring their progress to completion. The Dashboard provides positive return on investment (ROI) by providing real-time monitoring of the entire group of parks and recreation assets at once. For example, perhaps it’s not lucrative to create a work order for bench replacement until there are ten benches that need to be replaced. With this in mind, the Dashboard program can have a set threshold to alert staff when ten-plus benches’ conditions have been marked as “poor.” The customizable nature of GreenCityGIS programs allow for any number of parameters to be set with associated notifications for better parks management.
Conclusion
Karl Coughlin, The City of South Portland’s Parks, Recreation, & Waterfront Deputy Director explains, “The City of South Portland Parks, Recreation and Waterfront Department couldn’t be happier with GreenCityGIS. GTG employs talented, caring team members that are knowledgeable, responsive and professional. Their team has been absolutely fantastic to work with and have tolerated the many, many questions I’ve asked them. We look forward to growing this great relationship in the future.”
As the city expands the use of GIS throughout their various departments, GTG is looking forward to the pleasure of working with the City of South Portland again soon. Until then, their Parks and Recreation team will continue to utilize the programs that have been implemented for internal asset management, work order assignment, and community engagement.


