Example Uses
Promoting Public Health and COVID-19 Relief

Examples:
- Public Health Common Operational Picture
- Recovery Dashboard
- Wellness Checks
- Vaccine Outreach
- Testing Sites
- Facility and Employee Status
- Vaccine Coverage Analysis
- Community Health Outreach
Economic and Equitable Recovery
Examples:
- Identify economic impact
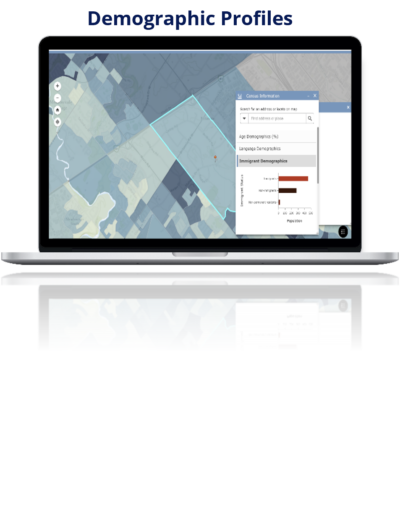
- Identification of disadvantaged areas based on census geography
-Low and moderate-income communities and jobs - Mapping of employment opportunities
- Mapping of job training opportunities for unemployed workers
- Identification and mapping of childcare and educational opportunities
- Identification and mapping of transportation opportunities for those seeking work
- Mapping unemployment trends
- Mapping of pre-COVID businesses and post-COVID businesses
- Economic and equity dashboard and common operational picture
- Retain and Promote Business
-Assisting existing businesses in recovery
-Identifying, tracking, and mapping businesses that were closed during the pandemic - Promoting your community’s unique qualities to attract new business
- Identify and promote the unique diversity of your community
- Encouraging business in disadvantaged areas
- Demographic analysis
- Supporting a public jobs program
- Tracking neighborhood recovery efforts
- Tracking neighborhood stabilization
- Identification of opportunity deserts
- Identify areas of economic harm based on the above factors
- Creation of an assistance tracking dashboard and common operational picture – where are funds being directed.
Recovery Through Affordable Housing
Examples:
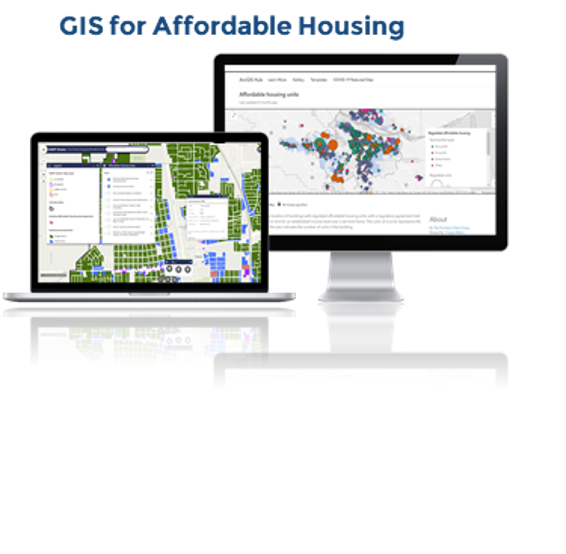
- Mapping Affordable Housing locations
- Housing Stock GIS layer creation
- Location Indices
- Demographic Profiles and Analysis
- Affordable Housing Common Operational Picture
- Affordable Housing Dashboards
- Living Atlas Data and Qualified Census Tracts
- Evaluate American Community Survey Data
- MHI
- Poverty rate
- Unemployment
- Race and ethnicity
- Education
- Vacant Property Identification and Tracking
- Community Development Block Grant (CDBG) Areas
- Racially or Ethnically Concentrated Areas of Poverty (RECAPs)
- Equitable program distribution
Recovery Through Homelessness Services
Examples:
- Homelessness Common Operational Picture
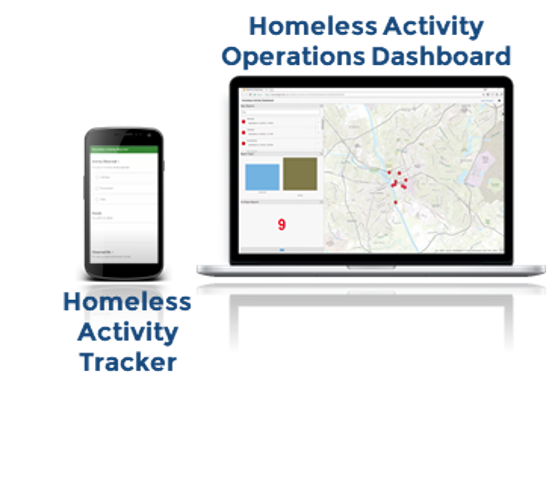
- Homelessness Dashboards
- Tracking homeless encampments
- Point in time homelessness counts
- Shelter location
- Medical facility locations
- Map race, destination, and permanent housing placement type (e.g., PSH, RRH) over a specified time period to see where clients are being placed within the community in order to understand placement rates by race
- Using mobile GIS for tracking homelessness and key metrics
- Homeless activity reporter application – engage the organization and the public.
- Equitable program distribution
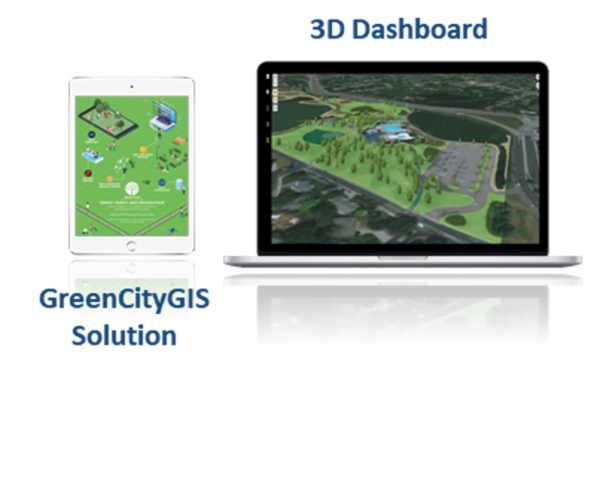
Recovery Through Parks and Recreation (Public Health and Infrastructure)
Examples:
- Safe Social Distanced Parks
- Mapping all park locations and amenities
- Equitable park and program distribution
- Demographic profile and park distribution
- Walkability Indices – are parks within walking distance
- Parks and recreation opportunity locations to promote a healthy childhood environment
- Ensuring neighborhoods have parks and recreation programs and opportunities for at-risk youth
- Opportunities for qualified census tracts
- Racial Equity and Community Outreach – parks and recreation opportunities
Recovery Through Public Works and Infrastructure Investments
Examples:
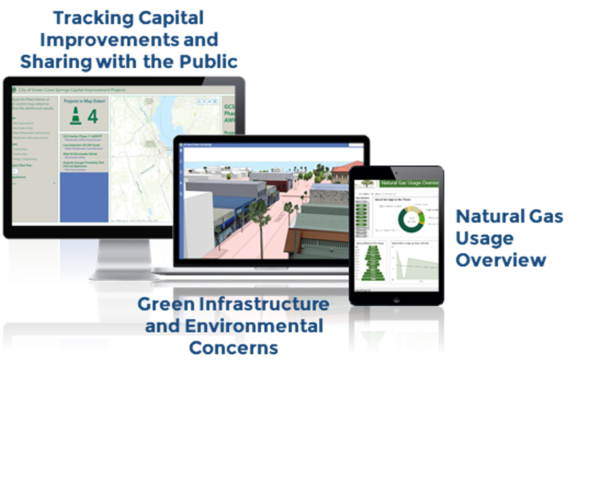
- Mapping critical infrastructure
- Mapping green infrastructure
- Planning and tracking capital improvement projects
- Community outreach and engagement on infrastructure improvements
- Optimizing and tracking capital investments
- Ensuring staff can access and improve data about infrastructure in the field
- Tracking investment equity
Recovery Through Distribution and Access to Broadband
Examples:
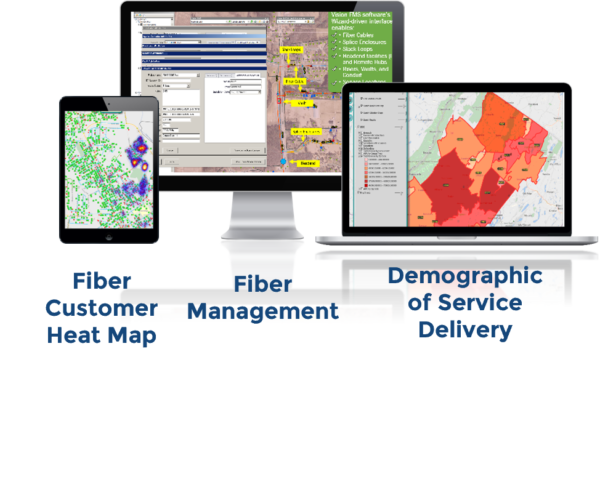
- Planning and Designing Broadband Expansion with Fiber Management Tools
- Identifying broadband expansion opportunities
- Identifying broadband deserts
- Optimizing broadband opportunities
- Identifying subscribers and promotion of equitable distributions
